Activation Likelihood Estimation
In active development with citations
Turkeltaub, 2002
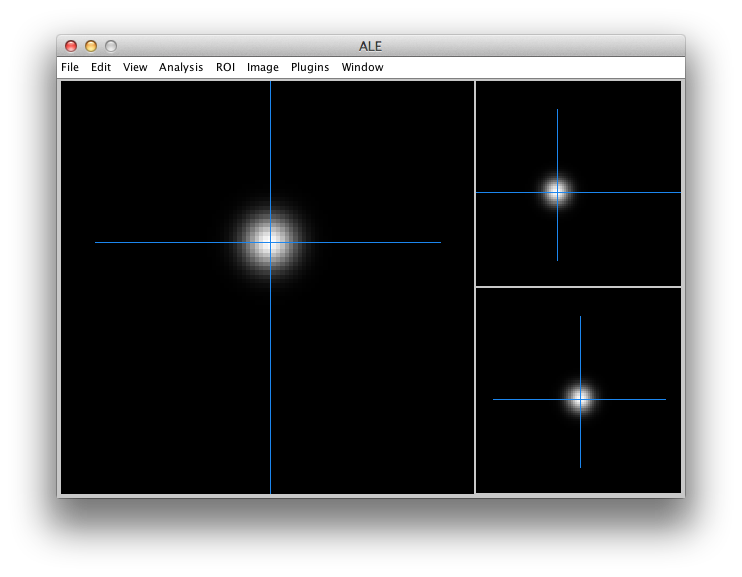
Each coordinate used a Gaussian (image) to blur it into a large probabilistic area that overlap to show agreement. Used iterating on random data to compute P values.
Explain 2d image from stats page is really 1d with y axis as values. Show 3d fuzz ball image

Eickhoff, 2009
Use the study-specific nature of the foci to create one image per study. This allows for varying the Guassian size between experiments, which could be used to weight the studies by subject size. Also a MUCH faster way to compute P values.
Random Effects model - separates values from their locations using histograms of each experiment-level image
Analytical algorithm for computing P values. Move this to significance page?
Turkeltaub, 2012: Within-Experiment Effects
Discuss minimizing bias of a single study with many nearby coordinates. Maximum not union. Limits the effect of many foci within an experiment-level image. The experiment level images are still combined into the ALE image using union.
Null results don't affect ALE - here and here
